

Nitrogen plant trend analysis is one of the most powerful yet underused skills in cryogenic operations.
Most failures in a cryogenic nitrogen plant do not occur suddenly. They develop slowly through small changes in temperature, pressure, purity, and energy consumption — long before alarms or trips appear.
Engineers who understand nitrogen plant trend analysis can detect instability, freezing risks, and equipment problems days or even weeks in advance.
In this guide, you’ll learn:
Which trends matter most in nitrogen plants
What normal vs abnormal patterns look like
How to recognize early failure signatures
How to act before problems escalate
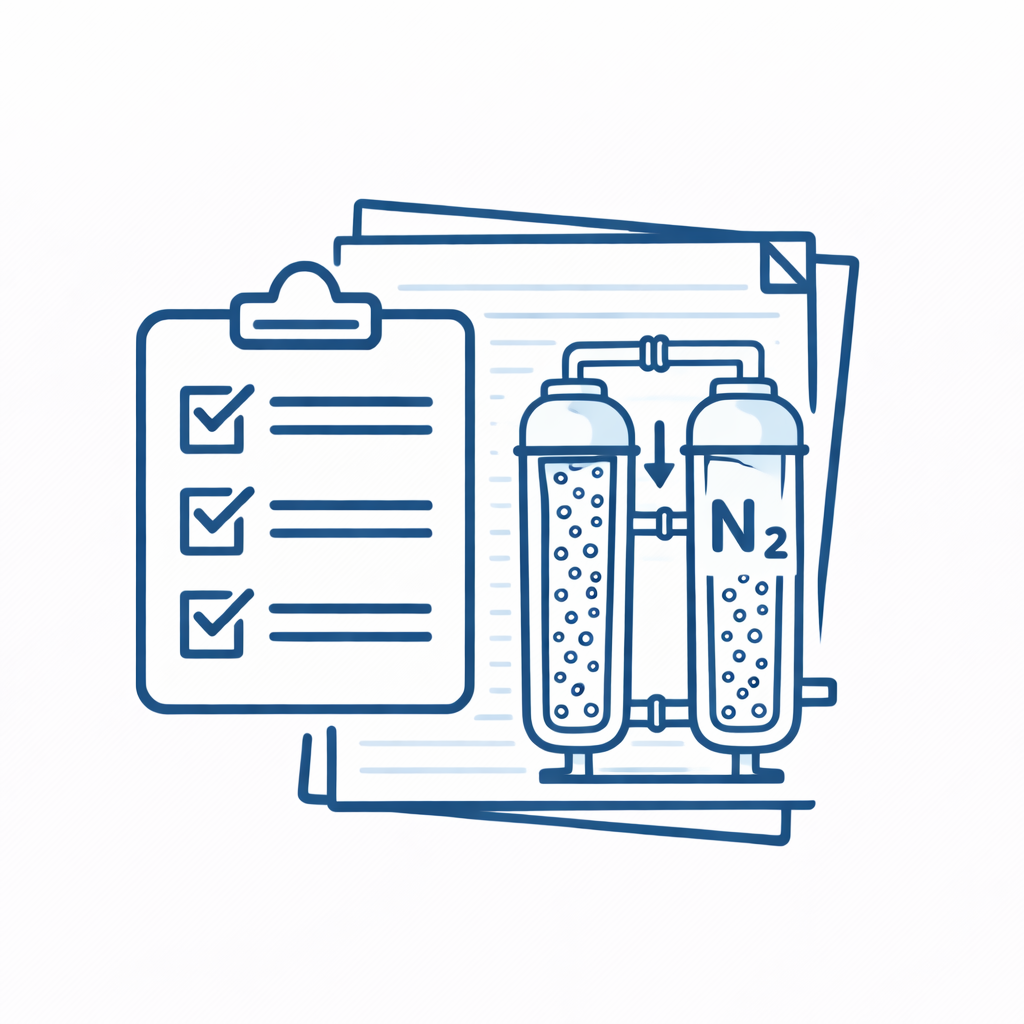
 Engineers often use a structured Trend Reading Pattern Guide to quickly interpret plant signals and link them to failure modes.
Process trends provide early warning signals of instability, inefficiency, and potential failures in cryogenic nitrogen plants.
To interpret these signals and take proactive action, use the Cryogenic Nitrogen Plant Stability Toolkit, which provides a structured approach to analyze trends and maintain stable plant operation.
Cryogenic plants operate very close to thermodynamic limits. Even small deviations can quickly lead to:
Heat exchanger icing
Column instability
Compressor stress
Nitrogen purity excursions
Alarms only react after limits are crossed.
By contrast, nitrogen plant trend analysis enables preventive action before damage begins.
For example, a slow pressure drop increase across the cold box can predict freezing days before any trip occurs.
For commissioning and baseline behavior, refer to our [Cryogenic Nitrogen Plant Commissioning Guide]

Monitor:
Main exchanger inlet/outlet temperatures
Column top & bottom temperatures
Temperature approach differences
 Warning patterns:
Widening temperature approach
Sudden localized cold spots
Slower cooldown response
These trends often indicate flow restriction or freezing onset.
Related: [Cold Box Freezing in Nitrogen Plants]

Track:
Exchanger ΔP
Column feed pressure
Product line pressure
Warning patterns:
Steady upward pressure drop
Fluctuations during steady load
A rising cold box pressure drop trend is one of the earliest freezing indicators.

 Product Purity Stability
Monitor:
Oxygen ppm in nitrogen
Analyzer correction frequency
Response time
Warning patterns:
Increasing oscillations
Frequent control actions
Slow stabilization
Poor purity trend monitoring often signals column imbalance or contamination.
Fluctuations in trends often reflect changes in nitrogen purity.
You may also read: Why Nitrogen Plant Purity Fluctuates to understand how process variations affect product quality.


Track:
Dew point before cold box
Adsorber cycle times
Regeneration temperature
Warning patterns:
Shorter adsorption cycles
Dew point drift upward
Slow regeneration recovery
These pretreatment breakthrough trends are early predictors of cold box freezing.
Temperature trends can indicate early thermal imbalance or freezing risk.
Refer to Cold Box Freezing in Nitrogen Plants: Causes, Early Warning Signs & Recovery to understand the consequences.
The Trend Reading Pattern Guide includes real trend signatures matched to common nitrogen plant failures.


[Industrial Consulting Support] helps diagnose stability issues before forced shutdowns occur.
Trend analysis is closely connected with the following plant issues:
Process Instability in Cryogenic Nitrogen Plants Why Nitrogen Plant Purity Fluctuates Why Nitrogen Plant Energy Consumption Increases
To understand how proper operation and system control improve trend behavior, refer to:
Cryogenic Nitrogen Plant Operation – Complete Engineering Guide